
Game Objective
Learn to make thoughtful decisions through this business simulation.
You will change your strategy of supply management and pricing based on weather scenarios.
Your goal is to make as much money as you can in 15 days by selling lemonade at your lemonade stand.
Buy cups, lemons, sugar, and ice cubes, and then set your product based on the weather conditions and customer satisfaction. Start with the basic recipe, but try to vary the recipe and see if you can do better.

Lastly, set your price and sell your lemonade at the stand. Try changing up the price based on the weather conditions as well.
First you will create a business spreadsheet to record costs, sales and profit for further analysis and create graphs for a presentation using Microsoft Excel.
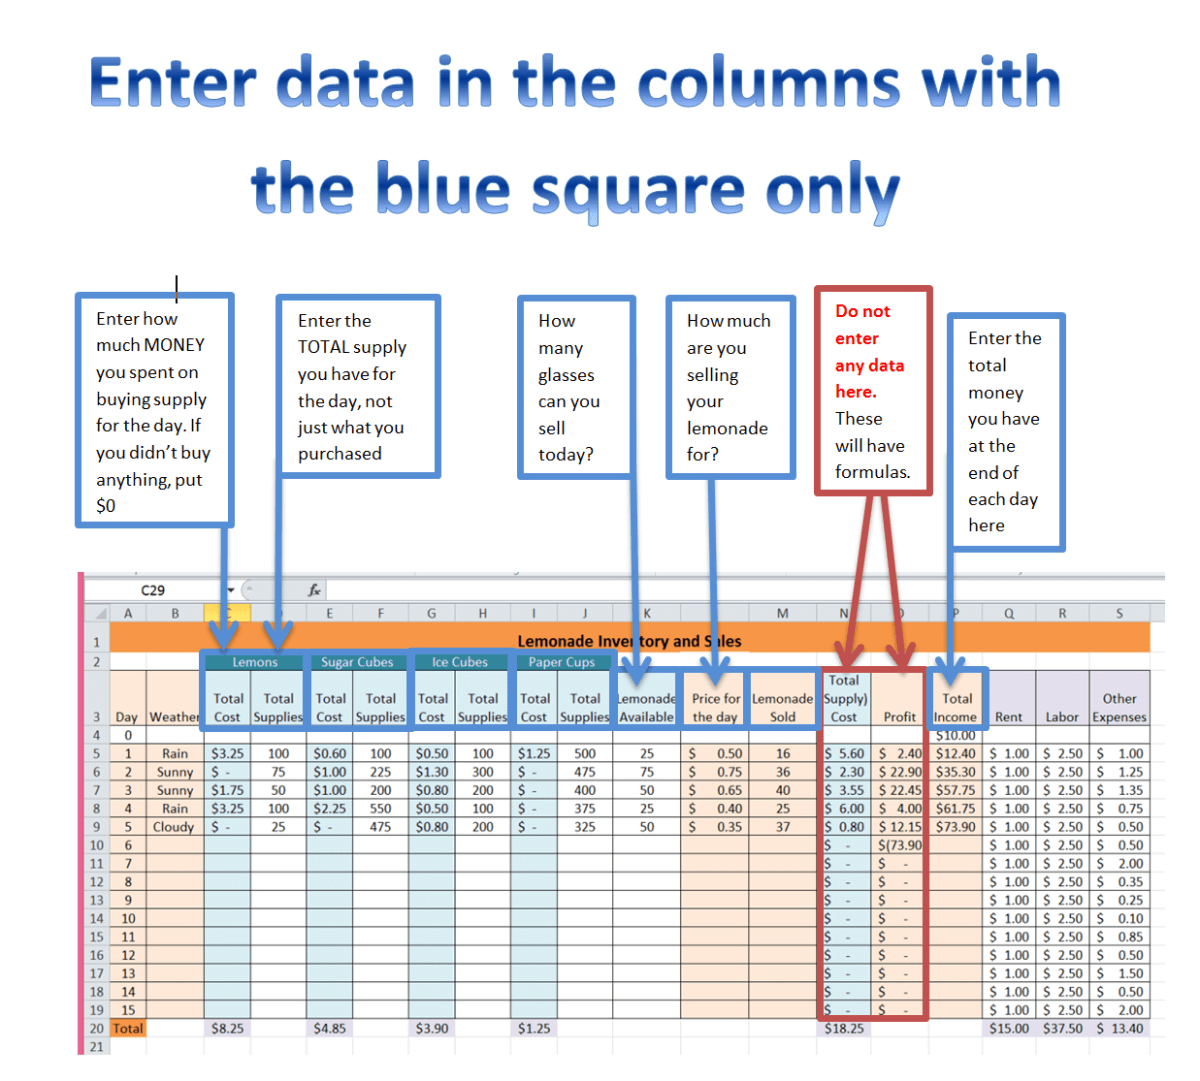
To learn more about Microsoft Excel Basics, click here or on the image below:

Project Worth and Outcome
This will count as a Summative Assessment for Marking Period 2.
This will count as 30% of your total grade when completed.
Due Dates:
The due date for part 4 is December 9th.
The due date for part 7 is December 13th.
Your final product will look similar to this: lemonade-stand-inventory-and-sales-familiare
Project Requirements
Part One
Create your spreadsheet by following the direction on this handout: lemonade-stand-game-student-handout
Watch the Video Tutorials by clicking Here
Part Two
Once you have completed your inventory and sales spreadsheet, you are on your way to being a successful CEO of your Lemonade Stand.
Next you must practice making good business decisions and recording data using the spreadsheet you just created.
YOU MUST PLAY AND RECORD AT LEAST 10 DAYS OF BUSINESS. Recording all 15 days will earn you 100 for this part.
Try to beat my score of Total Sales of $73.90 with a Good customer satisfaction after 5 days, however, you should try to complete as many days as possible and record them on your spreadsheet to gain maximum points.
RECORD ALL DATA IN YOUR SPREADSHEET
Use this spreadsheet if you have not completed step one: lemonade-stand-inventory-and-sales
*This sample file in not complete and you will still need to watch the tutorial videos to complete your project with all formulas.
Click here to play the Lemonade Stand Game.
Read instructions on How to Play.

Part Three
ANALYZE your data. What changes could you make in the way you are doing business to make your results better?
MAKE those changes to the way you are playing the game.
RECORD your new data
Complete the Following Analysis During Business:
After you have played 5 days:
- Describe your initial results: How were things going as you started this simulation?
- Analysis and Changes you made: Describe what data you used to make changes in the way you were doing business. What business trade-offs did you consider when running your Lemonade Stand Business?
- Results after you made the changes (10-15 days) : Describe how effective your business decision turned out to be based on your data. What decisions would you re-consider?
Part Four : Worth 100 points : Due December 9th
To Submit Parts 1, 2 and 3
E-mail your spreadsheet to familiare@uaglobalcommerce.org for grading
SUBJECT LINE MUST SAY “LEMONADE STAND GAME”
Part 1: Creating and Formatting your spreadsheet
Worth 20 points if all addition and subtraction formulas are correctly entered and chart looks properly formatted with fill colors, font colors, bold text and number formatting.
Part 2: Complete 15 days of data
- Worth 60 points if data is entered in to the correct cells for 15 days.
- Worth 55 points if data is entered in to the correct cells for 10 days.
- Worth 50 points if data is entered in to the correct cells for 8 days.
- Worth 45 points if data is entered in to the correct cells for 5 days.
Part 3: Complete Analysis of data and decision made.
Worth 15 points total for having a thoughtful response that uses examples from at least 3 days of recorded data to draw conclusions and/or reflect on what you would have done different.
Part 4: Submitting your work
E-mailing your work with the correct subject line is worth 5 points.
Part Five
Watch the Video Tutorials by clicking Here
Read the Instructions Here
Use this sample data sheet if you have not entered up to 10 days on your spreadsheet or if you have not entered all the data required
lemonade-stand-inventory-and-sales-15-days-sample-dat
CREATING GRAPHS
- VIDEO LINK: SCATTER GRAPH
Insert a Scatter Graph to show the relationship between Total Cost and Total Profit.
- VIDEO LINK: GRAPHING TOTAL INCOME
Insert a Line Graph to show the timeline of your Total Income.
- VIDEO LINK: COST OF INVENTORY GRAPH
Insert a Pie Graph to show to the cost associated with you inventory. - Create 2-3 more graphs to analyze other piece(s) of data.
Part Six
Complete the Following Analysis AFTER your Graphs are created:
- Total Daily Cost vs. Daily Profit : Describe the relationship you see in the graphs. What fluctuations do you see in your total daily cost vs. the daily profit? What do you think caused them? Indicate the specific days as a way to provide proof of your conclusion.
- Total Income: Describe the “Total Income” trend. Give 3 reasons why it may look that way and what you would do different in the future. Use specific data from the graphs. Indicate the specific days as a way to provide proof of your conclusion.
Part Seven (Worth 100 points)
- Add both analysis’ to your excel sheet, similar to the sample seen in the file: “Lemonade Stand Inventory and Sales Familiare”
- Submit: E-mail your Final Excel Sheet with Graphs and Analysis to Familiare@uaglobalcommerce.org for final grading by December 9th.
- Title Subject Line “Lemonade Stand Excel Spreadsheet”
Your Done! You have successfully used Microsoft Excel to record and analyzed data for the supply chain of lemonade stand!
